 Wow, I just passed 500 on my little hit-counter. Following the link, I discover that my traffic spiked on Tuesday. This is a pattern I've noticed in the past few weeks, suggesting that people are actually coming here to read my rants. Welcome to Bizarro-World!
Wednesday, August 02, 2006
500 Site Views!
Wow, I just passed 500 on my little hit-counter. Following the link, I discover that my traffic spiked on Tuesday. This is a pattern I've noticed in the past few weeks, suggesting that people are actually coming here to read my rants. Welcome to Bizarro-World!
Subscribe to:
Post Comments (Atom)


2 comments:
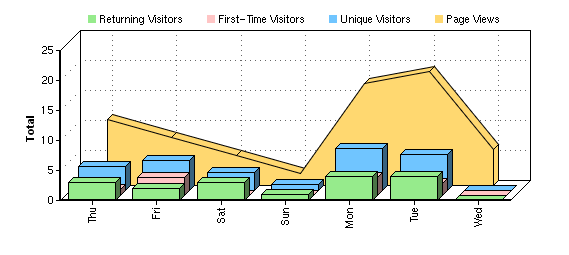
I have a question, that perhaps you can answer. In the figure showing your page viewing activities, the beige coloured bar, "Page-Views" has the individual values connected (such that it is a continuous line). Now, I was taught in Analytical Chemistry, that you should never connect the dots in the first place (you should draw a "best-fit" or regression line) but most importantly, you should never connect the dots in STOCHASTIC measurements. What does the line connecting values represent? The time between Monday's single measurement and Tuesday's? What's between these two days? Dear Watson, what should I do?!?!?!
First, kick Watson in the head - he's a doofus, and he's lost his mind. Call it Wallace syndrome: great minds blow out.
Second, it's a silly graph from a web-tools company run by undereducated people. You're citing instructions from Analytical Chemistry; what proportion of the web-reading population a) went to university AND b) majored or minored in Science AND c) took such a course AND d) actually remembered anything from the course?
The little bar-graphs showing first-time vs. returning visitors is probably more relevant.
Post a Comment